1
2
3
4
5
6
7
8
9
10
11
12
13
14
15
16
17
18
19
20
21
22
23
24
25
26
27
28
29
30
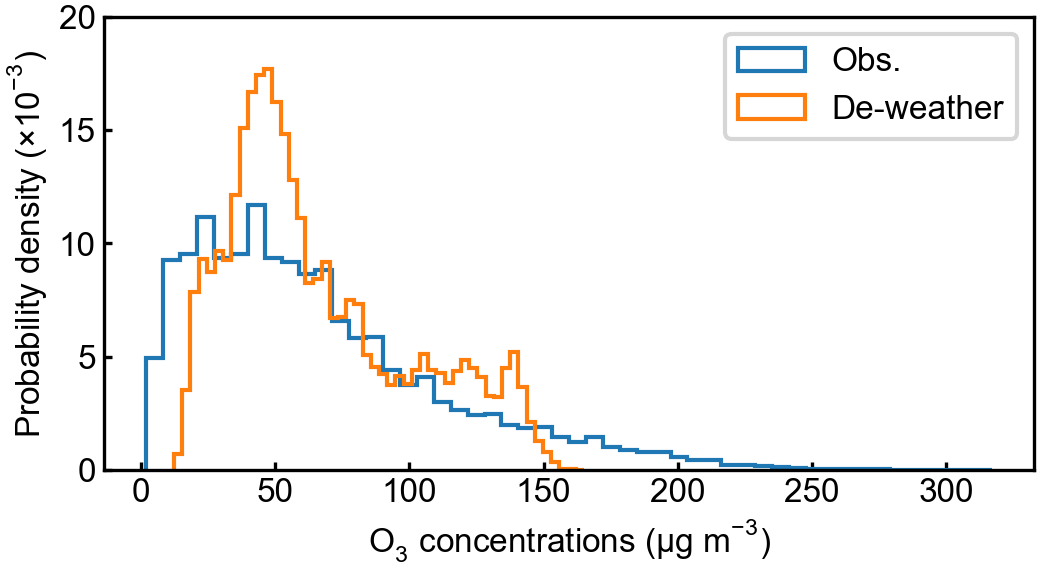
| y1 = orgdata["O3"]
y2 = dwedata["O3"]
config = {
'xtick.direction': 'in',
'xtick.major.size': 2,
'xtick.minor.size': 1,
'ytick.direction': 'in',
'ytick.major.size': 2,
'ytick.minor.size': 1,
'axes.labelpad': 2.0,
}
plt.rcParams.update(config)
fig, ax = plt.subplots(1,1,figsize=(4,2))
ax.hist(y1, 50, histtype='step', stacked=True, fill=False, density=True,label=["Obs."])
ax.hist(y2, 50, histtype='step', stacked=True, fill=False, density=True,label=["De-weather"])
pmax = 0.02
ax.set_yticks(np.linspace(0,pmax,5))
ax.set_yticklabels(np.linspace(0,pmax*1000,5,dtype=int))
ax.set_ylabel(r'$Probability\ density\ (\times 10^{-3})$')
ax.legend()
ax.set_xlabel(r"$O_{3}\ concentrations\ (\mu g\ m^{-3})$")
figname = f"{homepath}/figures/O3_pdf.png"
plt.savefig(figname, dpi=300, bbox_inches='tight',pad_inches = 0.05, facecolor='w')
|