1
2
3
4
5
6
7
8
9
10
11
12
13
14
15
16
17
18
19
20
21
22
23
24
25
26
27
28
29
30
31
32
33
34
35
36
37
38
39
40
41
42
43
44
45
46
47
48
49
50
51
52
53
54
55
56
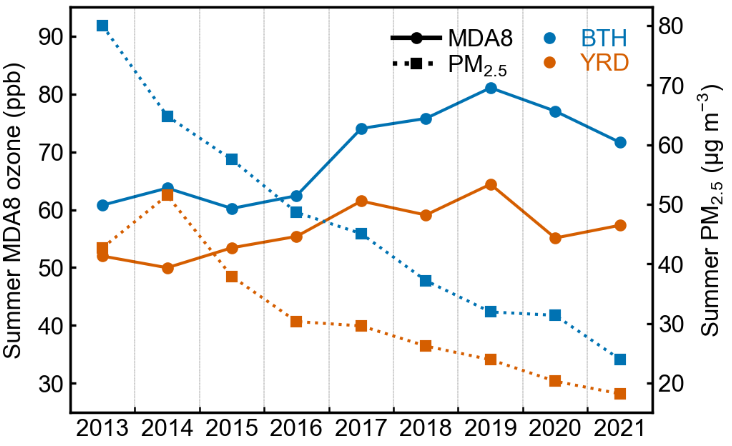
| config = {
'xtick.major.size': 0,
'xtick.minor.size': 2,
'ytick.major.size': 2,
'ytick.minor.size': 1,
}
plt.rcParams.update(config)
seasondict = { 'Spring':(25,75),
'Summer':(25,95),
'Autumn':(18,68),
'Winter':(8,45)}
xx = np.array([1,2,3,4,5,6,7,8,9])
for season,ylims in seasondict.items():
dfs = pd.read_csv(f"../obsdata/MDA8trends_{season}.csv")
arr2d10 = dfs[['2013','2014','2015','2016','2017','2018','2019','2020','2021']].values
arr2d11 = dfs.query("region == 'NCP'")[['2013','2014','2015','2016','2017','2018','2019','2020','2021']].values
arr2d12 = dfs.query("region == 'FWP'")[['2013','2014','2015','2016','2017','2018','2019','2020','2021']].values
arr2d13 = dfs.query("region == 'YRD'")[['2013','2014','2015','2016','2017','2018','2019','2020','2021']].values
dfs = pd.read_csv(f"../obsdata/pm25trends_{season}.csv")
arr2d20 = dfs[['2013','2014','2015','2016','2017','2018','2019','2020','2021']].values
arr2d21 = dfs.query("region == 'NCP'")[['2013','2014','2015','2016','2017','2018','2019','2020','2021']].values
arr2d22 = dfs.query("region == 'FWP'")[['2013','2014','2015','2016','2017','2018','2019','2020','2021']].values
arr2d23 = dfs.query("region == 'YRD'")[['2013','2014','2015','2016','2017','2018','2019','2020','2021']].values
fig, ax = plt.subplots(figsize=(3.5,2.5))
ax.plot(xx, np.nanmean(arr2d11,axis=0),'o-',ms=3,color='C0',lw=1.,zorder=2)
ax.plot(xx,np.nanmean(arr2d13,axis=0),'o-',ms=3,color='C2',lw=1.,zorder=2)
axw = ax.twinx()
axw.plot(xx, np.nanmean(arr2d21,axis=0),'s:',ms=3,color='C0',lw=1.,zorder=2)
axw.plot(xx,np.nanmean(arr2d23,axis=0),'s:',ms=3,color='C2',lw=1.,zorder=2)
ax.plot([],'ko-',ms=3,label="MDA8")
ax.plot([],'ks:',ms=3,label="$PM_{2.5}$")
ax.plot([],'.',color='C0',label="BTH")
ax.plot([],'.',color='C2',label='YRD')
for i in range(8):
ax.axvline(x=1.5+i,ls='--',lw=0.1,c='k')
leg = ax.legend(frameon=False,ncol=2,loc=1, handletextpad =0.3,
columnspacing=0.5, labelspacing=0.1, handlelength=2., )
for h, t in zip(leg.legendHandles, leg.get_texts()):
t.set_color(h.get_color())
ax.set_xlim(0.5,9.5)
ax.set_ylim(ylims)
ax.set_xticks(xx)
ax.set_xticklabels(years,rotation=0.)
ax.set_xticks(xx+0.5,minor=True)
ax.set_ylabel(f"{season} MDA8 ozone (ppb)")
axw.set_ylabel(f"{season} " + "$PM_{2.5}\ (\mu g\ m^{-3})$")
plt.savefig(f'../figures/pm25MDA8_trends_{season}',bbox_inches='tight',pad_inches = 0.05, dpi=300, facecolor='w')
|